












How to Run a Windows 11/10 Performance Test Using Performance Monitor
Benchmark and diagnose your PC’s health with the built-in Performance Monitor tool.
Overview
Performance Monitor (perfmon) is Windows’ built-in tool for measuring system performance and generating diagnostic reports. This guide shows how to run a performance/health report and read live counters.
Running a Windows performance test with Performance Monitor.
Key Takeaways
- Performance Monitor (perfmon) is built into Windows.
- The System Diagnostics report gives a health/performance summary.
- Data Collector Sets record metrics over time.
- Live counters show real-time CPU, disk, memory, and network use.
Generate a System Diagnostics Report
1. Press Windows + R, type perfmon /report, and press Enter.
2. Wait about 60 seconds while it collects data.
3. Read the report’s summary, warnings, and resource breakdown (CPU, memory, disk, network).
Use Performance Monitor Counters
1. Run perfmon and open Monitoring Tools > Performance Monitor.
2. Click the green + to add counters (e.g., Processor, Memory, PhysicalDisk).
3. Watch the live graph to spot bottlenecks.
4. Change the graph type (line/report) for readability.
Create a Data Collector Set
1. In perfmon, expand Data Collector Sets > User Defined.
2. Right-click > New > Data Collector Set and choose counters to log.
3. Set a schedule/duration and start it.
4. Review the logged report afterward to analyze trends.
Other Quick Checks
- Task Manager > Performance for a fast live overview.
- Resource Monitor (resmon) for detailed per-process resource use.
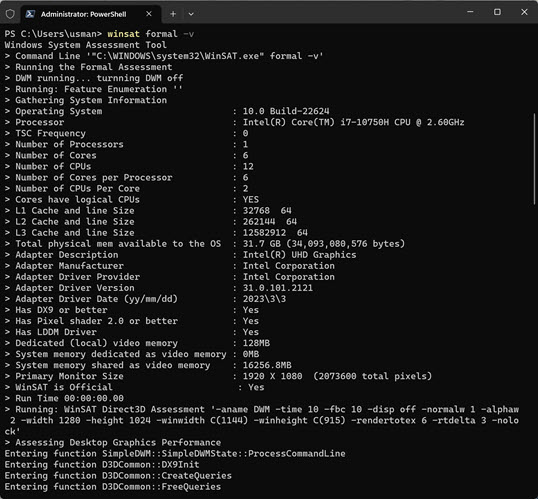
- WinSAT (winsat formal) for a formal assessment score.
Troubleshooting
Problem: perfmon /report shows errors.
Solution: Run it as administrator; some data collectors need elevation.
Problem: Report is empty.
Solution: Let it run the full ~60 seconds without closing the window.
Problem: Counters missing.
Solution: Rebuild the counters: run lodctr /R in an elevated prompt.
Problem: Want a single score.
Solution: Run winsat formal, then check the results in the WinSAT report or Get-CimInstance Win32_WinSAT.
Conclusion
Performance Monitor’s System Diagnostics report (perfmon /report) is the quickest way to get a health and performance summary, while live counters and Data Collector Sets let you dig into bottlenecks over time — all built into Windows, no extra tools needed.